Using Project Analyzer
                                            Overview


                                            Throughout Project Analyzer, 
 the user interface features the same layout allowing for 
 an intuitive user experience.
                                            
                                                - Ribbon style 
 toolbar with multiple tabs providing access to different project management 
 tasks.
- The Project 
 list, providing quick access to other projects and opportunities.
- A graphical 
 display area that presents the user with a chart related to the current 
 tab data.
- A data grid 
 that provides access to detailed project data and data manipulation.
                                                
                                                    
                                                        Ribbon Style Toolbar


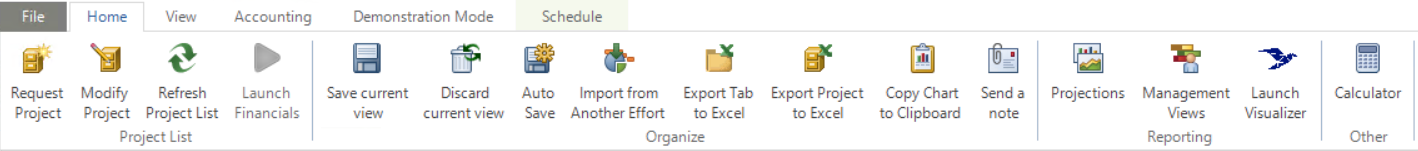
                                                        This area of the screen provides various tools and status indicators. 
                                                        Click on a ribbon bar tab to view 
 the available options. The Home 
 tab, View 
 tab and Accounting 
 tab are available regardless of which main tab is selected. Each Main 
 tab also has a corresponding ribbon bar tab, which includes tasks and 
 options specific to the main tab.


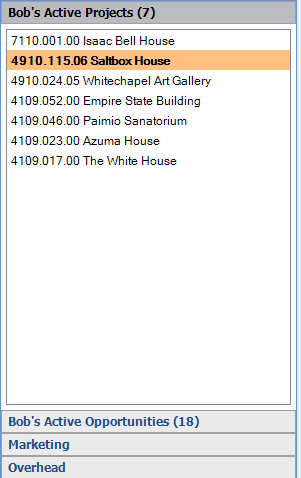
                                                                    | Active Project / Opportunity List The list of active projects and 
			opportunities are displayed 
			on the left hand side of the display. The project list is automatically 
			populated with project from the financial system. Click a project to 
			select it, or use the arrow keys on the keyboard to scroll through the 
			list. You can also narrow the project 
		list using the Filter option on the ribbon bar View 
 tab. Click a category bar (i.e., Active 
 Projects, Opportunities) 
 to view related efforts. The effort types available are configured on the System 
 Configuration Efforts tab.   |   | 


                                                                    Graphical Display


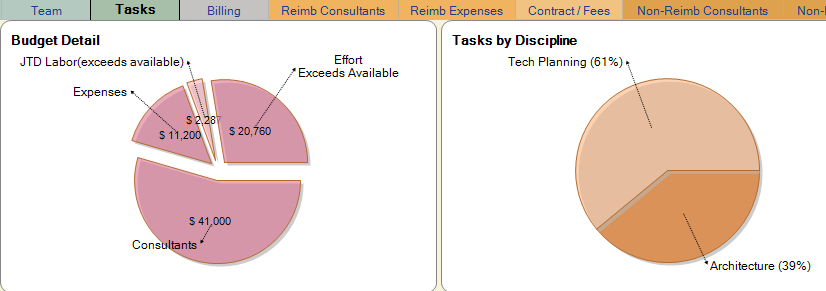
                                                                    The data from the current tab is displayed in a graphical format (i.e., 
 a Gantt or pie chart) while being edited and/or reviewed. Each display 
 is dynamic in that it responds immediately to changes made  in the 
 data grid.


                                                        Data Grid
                                                        The editing of data is done primarily in the data entry grids on each 
 of the main Project Analyzer tabs. Depending on the field type, calendar, 
 menu and calculator drop-down tools are available to help streamline data 
 manipulation. See Working 
 with the Data Entry Grid for more information.


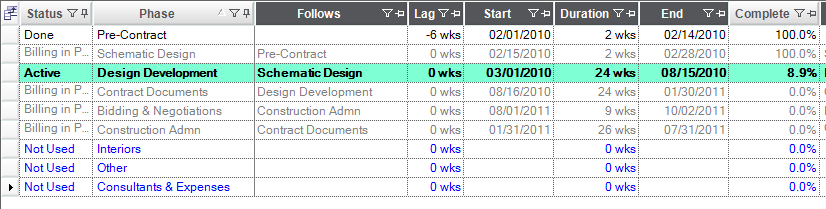
                                                         As data is modified, cells that are edited or 
 recalculated as a result of an entry are turned light blue for identification.
                                                         Hovering the mouse pointer over a modified cell 
 reveals a Previous Value tool tip 
 showing all prior values the cell has held since the last committed save.