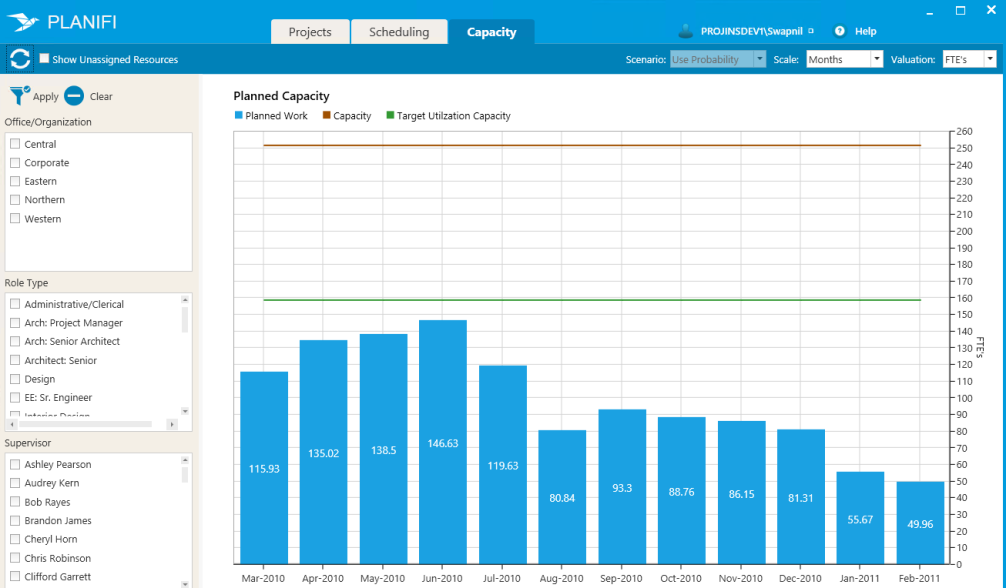
About the Capacity tab
The Capacity tab is a visual representation of the team projection and displays resource demand across all your projects.
What's on the Capacity tab
Selection pane
The Selection pane displays the following lists across all your projects.
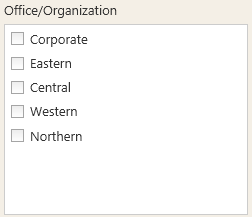
- Office/Organization - This allows you to only view project phases for specific offices/organizations and is helpful for managers and principals to filter the projects to only view those projects that are important to them.
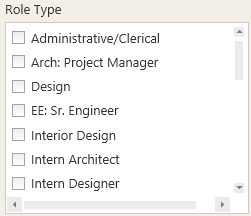
- Role Type - View capacity based on the type of roles.
- Supervisor - Narrow down the demand capacity based on the supervisor/s.
Note: Project Visualizer is integrated with Project Analyzer and derives all the settings and permissions from Project Analyzer, so depending on what role/permissions you have in Project Analyzer, you will only see the relevant offices, roles and supervisors in the Selection pane.
Actions bar
The Actions bar shows a Refresh button and a Show Unassigned Resources check-box (to view all currently unassigned resources across projects).

You can also view the capacity using different scale (months/weeks) or valuation (FTEs/hours).

Dashboard
The Dashboard displays a graphical view of planned capacity across the various reporting criteria.
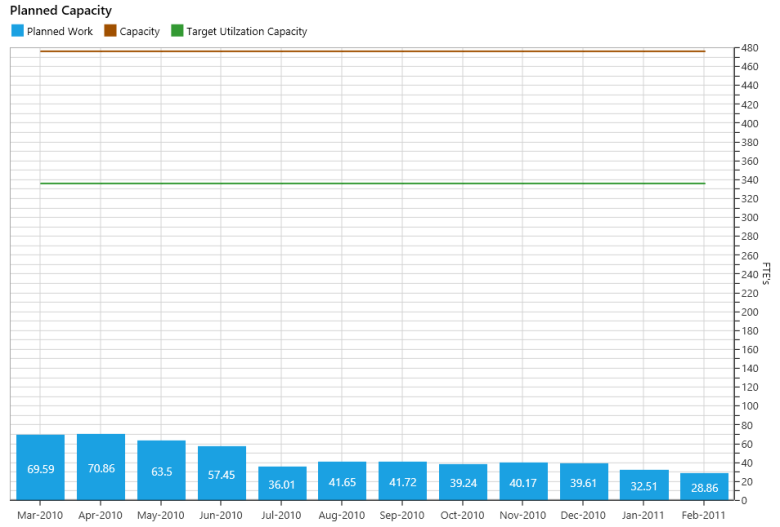
The graph is broken down into:
- Planned Work - Indicates the amount of work planned over a period of time. Shown in either FTEs (Full Time Equivalent – should have definition in dictionary) or in Hours depending on the settings.
- Target Utilization Capacity - Indicates the amount of capacity (FTE) your organization has over the same period of time. Capacity is calculated as the FTE Value X Their Utilization Target i.e. 1 FTE with 65% target would be .65FTE. If displayed in hours 1 FTE with 40 available hours and a target utilization of 75% per week would show as 30 hours.
- Capacity - Indicates the amount of capacity (FTE) your organization would have over the period of time if we do not consider any leave and the resources work all the time.
Reading the Capacity Dashboard
- All planned hours are derived from the Team tab in Project Analyzer.
- A typical firm would want to target close to or above the green line and below the red line in the near term. A trend above the red line for an extended amount of time may indicate the need for additional resources.