About the Projects Tab
The Projects tab provides firms a scheduling view of all their on-going projects with relevant deliverables and remaining effort all in one screen.
What's on the Projects tab
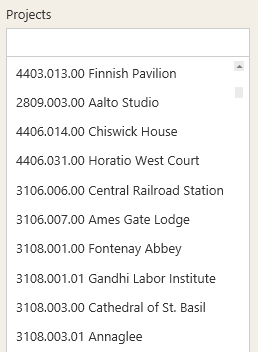
The Selection pane displays a list of projects for your organization.
Note: By default, the Projects list only displays the same projects that are listed under My Projects in Project Analyzer. If you have permission to view all projects in Project Analyzer, you will see all projects when you tick this option.
Use filters in the selection pane to view a particular project dashboard by simply selecting the one you want to view. You can also search for a particular project using the Projects search field.
The Actions bar shows a Refresh, Export button and a View All Projects toggle (to displays all projects for your organization).

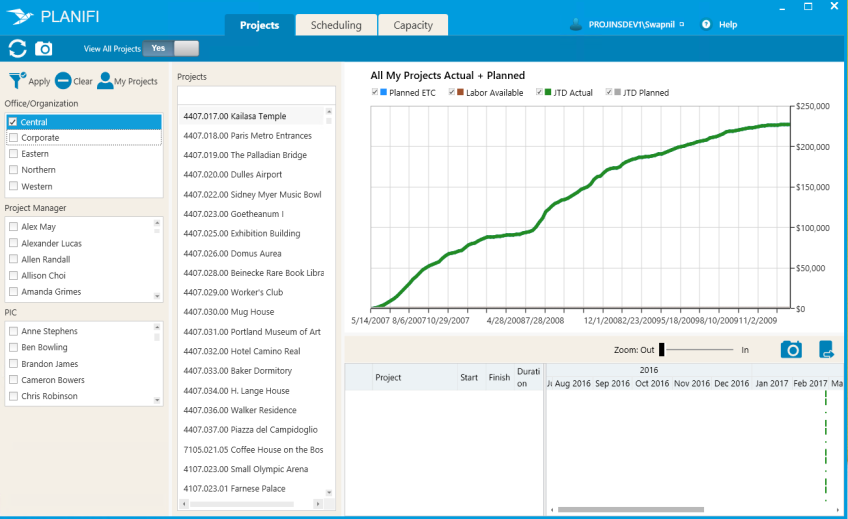
The Dashboard is divided over 3 areas:
- Project Graph (top half)
- Project Timeline (lower left half)
- Project Gantt Chart (lower right half)
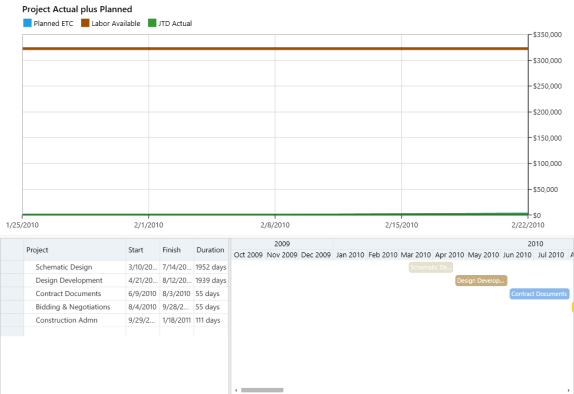
On the Project Graph, the following values are displayed:
- Labor Available – This amount is the total amount of Labor available on a project. It is similar to the initial Labor Available or Net Fee in Project Analyzer.
- Planned ETC – This value is the cost of planned labor from the Team tab for the remainder of the project
- JTD Actual (Job to Date) – This is the actual cost of posted labor from Deltek Vision on the project from inception to the last posting date
- JTD Planned (Job to Date) – This is the value of Planned Labor from the Team tab in Project Analyzer from inception to the current date.
Note: Comparing JTD Actual vs. Planned displays how much you are over/under on your project vs. your original plan.