Labor Budget Chart
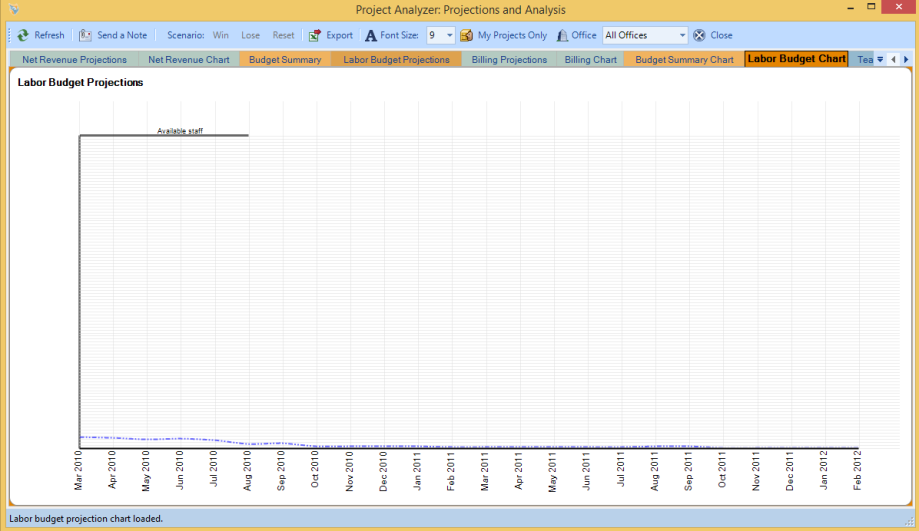
The Labor Budget Chart tab displays the data from the manpower projections grid based on its current display.
The chart is shown as filtered on the Labor Budget Projection. For example, if filtered per office one line would display for each office. Additionally, the first level of grouping will be used for secondary charting.