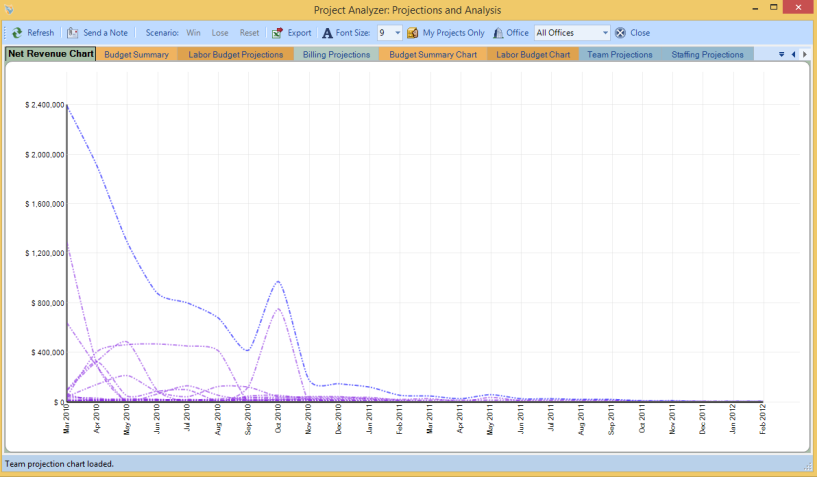
Net Revenue Chart
The Net Revenue Chart tab provides a graphical representation for the project earnings on a month-by-month basis. The monthly totals from the Net Revenue Projections tab are posted to the graph, showing you trends in the projected earnings for the project.